Research

SeisSmith
Overview
SeisSmith is the culmination of several of my undergraduate research projects exploring surface waves, bringing together seismic processing, visualization, and interpretation into a single, end-to-end software platform. I decided to pursue this project after recognizing the lack of accessible seismic interpretation resources at my university and the incredibly high cost of many industry-standard software packages. It became my mission to develop a tool that students and educators could use without the unrealistic financial barriers associated with commercial software, while still delivering a high-quality product capable of competing with industry alternatives.
Currently, SeisSmith can import raw MASW data, assign acquisition geometries, perform filtering and data editing operations such as cutting, smoothing, and zeroing, generate dispersion images, visualize dispersion energy in 3D, pick dispersion curves, perform inversions, and generate both 1D and 2D shear-wave velocity models. By integrating these capabilities into one platform, SeisSmith aims to make the entire MASW workflow more accessible, efficient, and intuitive.
Although SeisSmith is still in its beta stage, I hope to continue expanding its capabilities and eventually release an innovative, affordable alternative to traditional MASW software. Ultimately, my goal is to make high-quality near-surface seismic interpretation tools more accessible to students, educators, and researchers who might otherwise be limited by the cost of industry software.
Associated papers
Computational Framework for Surface-Wave Seismic Analysis Feasibility Study (PDF)
Website
Mode Picking
Overview
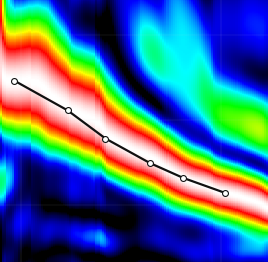
This project consists of a machine-learning study on the use of convolutional neural networks (CNNs) to automatically identify and extract fundamental-mode Rayleigh-wave dispersion curves from surface-wave dispersion images. These curves are essential for estimating subsurface shear-wave velocity profiles through MASW. Dispersion curves are identified manually by geophysicists, a process that can be time-consuming and subjective, particularly when working with noisy or complex datasets. The study will explore training a CNN on labeled dispersion images and evaluating its ability to recognize physically reasonable fundamental-mode trends. Model predictions will be compared with reference curves and established automated picking methods to assess accuracy, computational efficiency, and robustness to noise. The ultimate goal is to improve the consistency and efficiency of near-surface seismic interpretation through machine-learning-assisted processing and eventually deploy this project locally inside SeisSmith.
Acoustic Waves
Overview
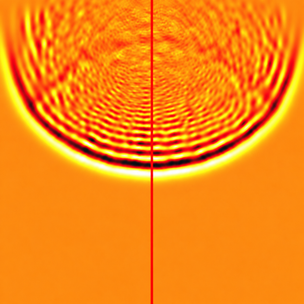
This project models the propagation of P-waves through a two-dimensional subsurface medium made up of shale and sandstone layers. A discrete finite-difference approximation of the 2D wave equation simulates seismic wave behavior across a grid representing 1,000 feet of depth and 1,000 feet across. The model uses an initial Gaussian pulse to simulate a seismic source, with each rock layer assigned unique velocity and density properties. Using MATLAB, the simulation visualizes how seismic energy propagates through layered media, reflecting and refracting at boundaries such as the shale-sandstone interface. Wave amplitudes, travel times, acoustic impedance, and velocity are examined to demonstrate how alternating lithologies and material properties influence seismic energy transmission. The project emphasizes the relationship between subsurface geology and seismic wave behavior.
Associated papers
Source code
Dispersion Data
Overview
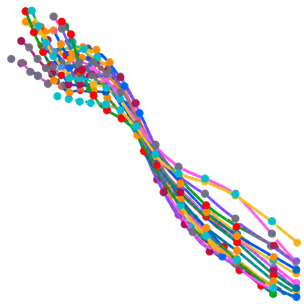
This project develops a Python-based workflow for automatically parsing, organizing, and visualizing surface-wave dispersion data generated through multichannel analysis of surface waves (MASW). The program imports multiple .LST files from SurfSeis/Multimodes-style processing, extracts frequency–velocity picks along with quality weights and mode numbers, and exports clean, reusable CSV files. Using NumPy arrays and cubic spline interpolation, the workflow generates smooth dispersion curves while preserving the original picked data. Combined dispersion plots, mode-separated curves, and pick weight versus frequency plots allow comparisons across different seismic datasets and help identify potential mode mixing or unreliable picks. Although no inversion is performed, this project demonstrates a reproducible approach to handling real seismic datasets, improving the efficiency of data processing and providing a foundation for future shear-wave velocity inversion and quantitative subsurface modeling.
Associated papers
Automated Parsing and Visualization of Surface-Wave Dispersion Data Using Python (PDF)

GMT Workbench
Overview
GMT Workbench is a personal project I developed out of frustration with the lack of an intuitive graphical user interface for Generic Mapping Tools (GMT). Built with Python and Qt, GMT Workbench combines local data import, editable scripts, layer management, and map previews into a single interface. Bundled GMT 4 and GMT 6 runtimes support legacy mapping workflows and modern GMT 6 classic commands. Users can adjust mapping parameters, reorder layers, and save projects alongside their scripts and PDF or PostScript outputs. An included Oklahoma gravity example demonstrates the visualization of geophysical grids, contours, and geological overlays. The project provides a practical workspace for organizing geoscientific datasets, modifying maps, and maintaining reproducible mapping workflows for geological and geophysical research.
Source code
Website

Interstate Quantum Hackathon 2026
Overview
I was a part of Missouri State University's Quantum Bears team for Middle Tennessee State University's Interstate Quantum Hackathon 2026. Our team focused on exploring wildfire modeling with Los Angeles County land-cover data. We combined a simulated four-qubit quantum kernel with nearest-neighbor regression to estimate hourly fire-danger classes and fuel conditions. Then, we used a travel-time model to visualize fire spread over the next 48 hours. The project brings together geographic data processing, quantum-kernel methods, and spatially separated evaluation against classical baselines.
Associated papers
Four-Qubit Quantum Kernel Methods for Wildfire Modeling (PDF)
Website
Interstate Quantum Hackathon 2026 — Challenge

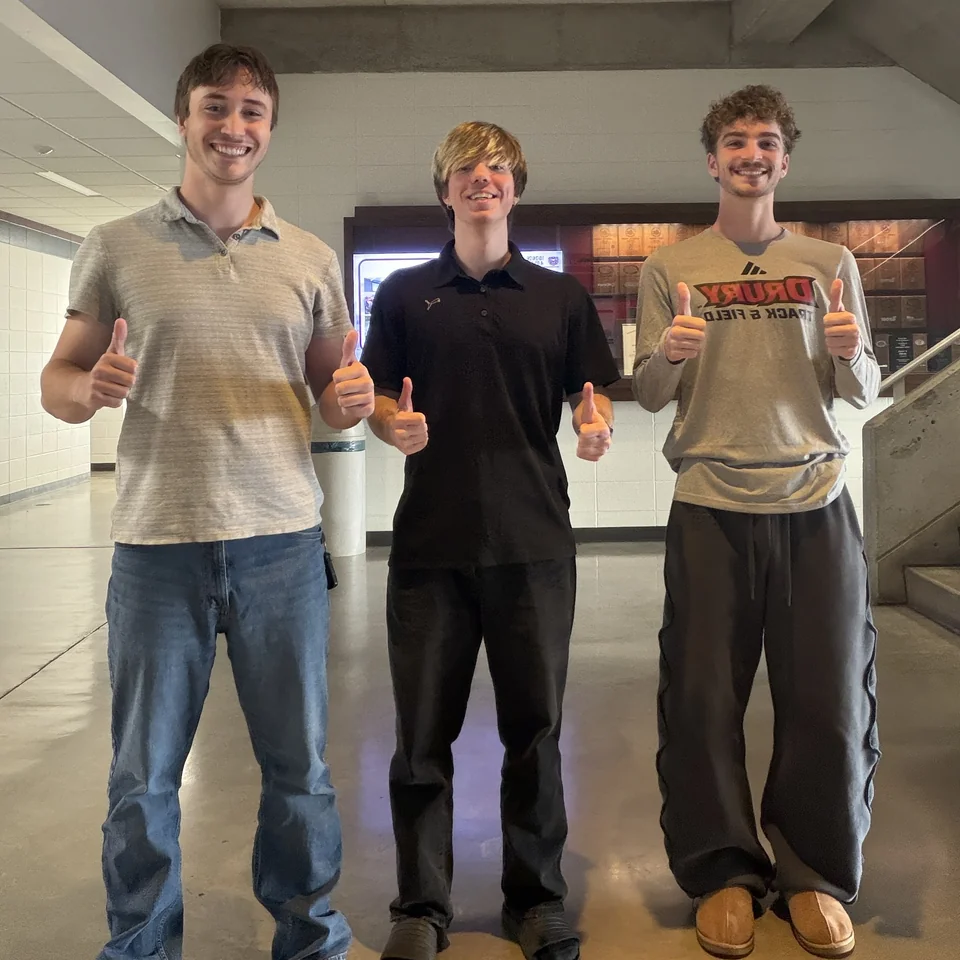
Not pictured: Josh Borthick, JJ Block